


Power Disturbance Characterization
REZA HAJIHA /Senior Electrical Engineer /Sharif University of Technology
-
Introduction
Short-term ac voltage disturbances can be classified into four major categories, as illustrated in Figure 10.1.
The categories are defined according to peak value and duration:
- Voltage surge: An increase of l0 to 35% above the nominal line voltage for a period of 16 ms to 30 s.
- Voltage sag: A decrease of 10 to 35% below the nominal line voltage for a period of 16 ms to 30 s.
- Transient disturbance: A voltage pulse of high energy and short duration impressed upon the ac The overvoltage pulse can be 1 to 100 times the nominal ac potential and can last up to 15 ms. Rise times measure in the nanosecond range.
- Momentary power interruption: A decrease to zero voltage of the ac power-line potential, lasting from 33 to 133 ms. Longer-duration interruptions are considered power outages.
Voltage surges and sags occasionally result in operational problems for equipment on-line, but automatic protection or correction circuits generally take appropriate actions to ensure that there is no equipment damage. Such disturbances can, however, garble computer system data if the disturbance transition time (the rise/fall time of the disturbance) is sufficiently fast. System hardware also may be stressed if there is only a marginal power supply reserve or if the disturbances are frequent.
Momentary power interruptions can cause a loss of volatile memory in computer-driven systems and place severe stress on hardware components, especially if the ac supply is allowed to surge back automatically without soft-start provisions. Successful system reset may not be accomplished if the interruption is sufficiently brief.
Although voltage sags, surges, and momentary interruptions can cause operational problems for equipment used today, the possibility of complete system failure because of one of these mechanisms is relatively small. The greatest threat to the proper operation of electronic equipment rests with transient over voltage disturbances on the ac line. Transients are difficult to identify and difficult to eliminate. Many devices commonly used to correct sag and surge conditions, such as Ferro resonant transformers or motor-driven autotransformers, are of limited value in protecting a load from high-energy, fast-rise-time disturbances.
In the computer industry, research has shown that a significant number of unexplained problems resulting in disallowed states of operation actually are caused by transient disturbances on the utility feed.
With the increased use of microcomputers in industry, this consideration cannot be ignored. Because of the high potential that transient disturbances typically exhibit, they not only cause data and program errors, but also can damage or destroy electric components. This threat to electronic equipment involves sensitive integrated circuits and many other common devices, such as capacitors, transformers, rectifiers, and power semiconductors. Figure 1.2 illustrates the vulnerability of common components to high-energy pulses. The effects of transient disturbances on electronic devices are often cumulative, resulting in gradual deterioration and, ultimately, catastrophic failure.
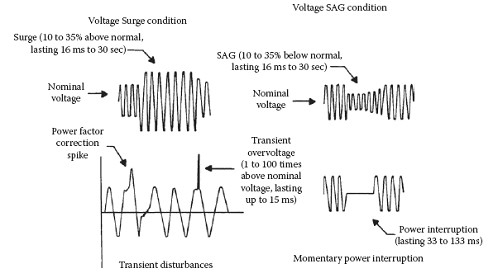
Figure 1.1 The four Basic classification of short – Term power-line disturbances.

Range of damage Threshold
Figure 1.2 An estimation of the susceptibility of common electric devices to damage from transient disturbances. The vertical line marked “discharge” represents the energy level of a discharge that typically can be generated by a person who touches a piece of equipment after walking across a carpeted floor.
- Standards of Measurement
Various test procedures and standards have been developed to enable system designers to evaluate the effectiveness of proposed protective measures. These range from simulation of lightning currents, voltages, and electric and magnetic fields to the generation of typical lightning-induced current and voltage transients expected to appear at the terminals of electronic equipment. Damaging effects can be divided into two basic categories:
- Direct effects: Damage to metal and insulator surfaces, and ignition of flammable vapors resulting from direct lightning attachment.
- Indirect effects: Damage resulting from the currents and voltages induced in internal circuits by lightning that has struck the exterior of a structure or a vehicle.
Because it is difficult to assess the threat posed by transient disturbances without guidelines on the nature of transients in ac power systems, a number of separate standards have been developed for individual component groups. The best known was developed by a working group of the Institute of Electrical and Electronics Engineers (IEEE) to simulate indirect lightning effects. IEEE suggested two waveforms, one unidirectional and the other oscillatory, for measuring and testing transient suppression components and systems in ac power circuits with rated voltages of up to 1 kV rms line-to-ground. The guidelines also recommend specific source impedance or short-circuit current values for transient analysis.
The voltage and current amplitudes, waveshapes, and source impedance values suggested in the American National Standards Institute/IEEE guide (ANSI/IEEE standard C62.41-1980) were designed to approximate the vast majority of high-level transient disturbances, but were not intended to represent worst-case conditions — a difficult parameter to predict. The timing of a transient overvoltage with respect to the power line waveform is also an important parameter in the examination of ac disturbances. Certain types of semiconductors exhibit failure modes that are dependent on the position of a transient on the sine wave.
Figure 1.3 shows the ANSI/IEEE representative waveform for an indoor-type spike (for 120 to 240 Vac systems). Field measurements, laboratory observations, and theoretical calculations have shown that most transient disturbances in low-voltage indoor ac power systems have oscillatory waveshapes, instead of the unidirectional wave most often thought to represent a transient overvoltage. The oscillatory nature of the indoor waveform is the result of the natural resonant frequencies of the ac distribution system.
Studies by the IEEE show that the oscillatory frequency range of such disturbances extends from 30 Hz to 100 kHz, and that the waveform changes, depending upon where it is measured in the power distribution system.
The waveform shown in Figure 1.3 is the result of extensive study by the IEEE and other independent organizations of various ac power circuits. The representative waveshape for 120 and 240 V systems is described as a 0.5 µ s to 100 kHz ring wave. This standard indoor spike has a rise time of 0.5 µ s, then decays while oscillating at 100 kHz. The amplitude of each peak is approximately 60% of the preceding peak.
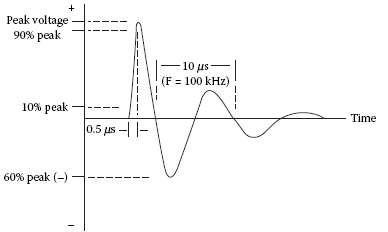
Figure 1.3 The suggested ANSI/IEEE indoor-type transient over voltage test waveform (0.5 µ s to 100 kHz ring wave, open-circuit voltage).
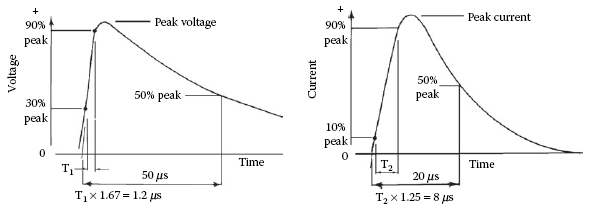
Figure 1.4 The unidirectional wave shape for outdoor-type transient over voltage test analysis based on ANSI Standard C62.1: (a) open-circuit waveform, (b) discharge current waveform.
Figure 1.4 shows the ANSI/IEEE representative waveforms for an outdoor-type spike. The classic lightning over voltage pulse has been established at a 1.2/50 µs wave shape for a voltage wave and an 8/20 µs wave shape for a current wave. Accordingly, the ANSI/IEEE standard wave shape is defined as 1.2/50 µs open-circuit voltage (voltage applied to a high-impedance device), and 8/20 µs discharge current (current in a low-impedance device).
The test wave shapes, although useful in the analysis of components and systems, are not intended to represent all transient patterns seen in low-voltage ac circuits. Lightning discharges can cause oscillations, reflections, and other disturbances in the utility company power system that can appear at the service drop entrance as decaying oscillations.
Unfortunately, most lightning disturbance standard waveforms address one or two characteristics of a discharge. Furthermore, standard waveforms are intended to represent typical events, not worst-case events. In testing to determine the immunity of a system to a direct lightning strike, a conservative approach is generally taken, in that the characteristics of a relatively severe flash are adopted. Figure 1.5 shows a test waveform specified for aerospace vehicles (MIL-STD-1757A). The current waveform includes one initial and one subsequent stroke, between which flows continuing current. Peak currents are 200 kA for the first stroke and 100 kA for the subsequent stroke. The total charge transfer is in excess of 200 C.
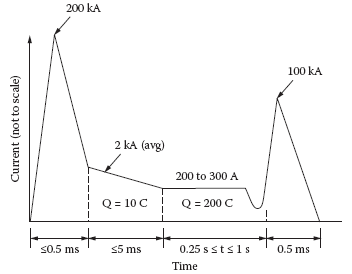
Figure 1.5 Lightning test current waveform specified in MIL STD-1757A. (After [1].)
2.1 Assessing the Threat
High-speed digital ac line monitoring instruments provide a wealth of information on the quality of incoming utility power at a facility. Such instruments have changed the business of assessing the threat posed by unprocessed ac from an educated guess to a fine science. Sophisticated monitoring equipment can give the user a complete, detailed look at what is coming in from the power company. Such monitoring devices provide data on the problems that can be expected when operating data processing, communications, or other sensitive electronic equipment from an unprotected ac line. Power-quality surveys are available from a number of consulting firms and power-conditioning companies. The typical procedure involves installing a sophisticated voltage-monitoring unit at the site to be used for a period of several weeks to several months. During that time, data is collected on the types of disturbances the load equipment is likely to experience.
The type of monitoring unit used is of critical importance. It must be a high-speed system that stores disturbance data in memory and delivers a printout of the data on demand. Conventional chart recorders are too slow and lack sufficient sensitivity to accurately show short-duration voltage disturbances. Chart recorders can confirm the presence of long-term surge and sag conditions, but provide little useful data on transients.
2.2 Fundamental Measurement Techniques
Most power system measurements involve characterizing fundamental parameters. These include voltage, phase, and frequency. Most other tests consist of measuring these fundamental parameters and displayingthe results in combination by using some convenient format. Measurements are made on equipment and systems to check performance under specified conditions and to assess suitability for use in a particular application. The measurements can be used to verify specified system performance or as a way of comparing several pieces of equipment for use in a system. Measurements can also be used to identify components in need of adjustment or repair.
Measurement of voltage is fundamental to ac operation. Voltage can be measured either in absolute terms or in relative terms. Power demand is an example of an absolute level measurement; it does not require any reference. Gain and loss are examples of relative, or ratio, measurements.
Distortion measurements are a way of quantifying the amount of unwanted components added to a signal by a piece of equipment. The most common technique is total harmonic distortion (THD), but others can be used. Distortion measurements express the amount of unwanted signal components relative to the desired signal, usually as a percentage or decibel value. This is another example of multiple level measurements that are combined to give a new measurement figure.
The simplest definition of a level measurement is the alternating current amplitude at a particular place in the system under test. However, in contrast to direct current measurements, there are many ways of specifying ac voltage. The most common methods include:
- Root-mean-square
- Average response
- Peak
2.2.1 Root-Mean-Square
The rms technique measures the effective power of the ac signal. It specifies the value of the dc equivalent that would dissipate the same power if either were applied to a load resistor. This process is illustrated in Figure 1.6. The input signal is squared, and the average value is found. This is equivalent to finding the average power. The square root of this value is taken to transfer the signal from a power value back to a voltage. For the case of a sine wave, the rms value is 0.707 of its maximum value.
Assume that the signal is no longer a sine wave, but rather a sine wave and several harmonics. If the rms amplitude of each harmonic is measured individually and added, the resulting value will be the same as an rms measurement on the signals together. Because rms voltages cannot be added directly, it is necessary
to perform an rms addition. Each voltage is squared, and the squared values are added as follows:
![]()
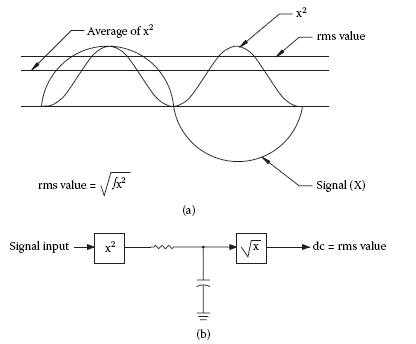
Figure 1.6 Root-mean-square (rms) voltage measurements: ( a ) the relationship of rms and average values, (b ) the rms measurement circuit.
- Reliability Considerations
Electrical energy is transmitted from the point of generation to end users through a highly complex transmission and control system. This network consists of a grid of conductors with numerous embedded components. A typical system may consist of thousands of nodes. The network is further complicated by the interconnection of individual systems. These interconnected systems must be capable of supplying energy despite diverse and challenging physical conditions. Detailed reliability analysis is required to provide an acceptable level of performance to customers.
It is not uncommon for a utility system to experience load swings of as much as 150 MW/min, mainly the result of changing heavy industrial loads. Such fluctuations introduce a host of challenges to reliability engineers. Primary design requirements include:
- The ability to handle large, constantly changing load demands from customers.
- A strong power source to provide for high inrush currents typically experienced at industrial plants.
- Rapid and effective fault isolation. Failures in one part of the system should have minimal effect on other portions of the network.
Utility companies are meeting these goals with improved reliability analysis, more operating reserve, and computerized control systems. Rapid response to load changes and fault conditions is necessary to ensure reliable service to customers. Improved telemetry systems provide system controllers with more accurate information on the state of the network, and advanced computer control systems enable splitsecond decisions that minimize service disruptions.
Reference
-Ulman, M. A., “Natural and Artificially Initiated Lightning and Lightning Test Standards,” Proceedings of the IEEE, IEEE, New York, NY.


